
BRAND
Trace For Good collects and centralizes manufacturing data for clothing and textile products. By working directly with suppliers and manufacturers throughout the supply chain, the company ensures it obtains detailed information on the materials used, production processes, and working conditions.
Using powerful digital tools, Trace For Good integrates this data securely and transparently, allowing brands to track each stage of the manufacturing process. This information is then transformed into labels that comply with AGEC requirements, offering total transparency to consumers and helping companies optimize their processes while reducing their environmental footprint.
brief
To enhance the efficiency of data collection and improve collaboration with suppliers, it is essential to develop an intuitive and powerful platform.
This platform must:
• Facilitate access to and entry of data requested by Trace For Good.
• Offer a clear, engaging user experience tailored to the needs of suppliers.
• Ensure the smooth and reliable transmission of the information required to create labels that comply with the AGEC law.
This project aims to transform a task often perceived as burdensome into a simple and motivating process for all parties involved.
context
With the rise of responsible fashion and the implementation of regulations such as the AGEC law, Trace For Good plays a key role in enabling brands to guarantee the traceability of their products.
However, collecting information from suppliers is a challenge. Many find the process complex and time-consuming, and lack clarity on the real benefits of their contribution. When a customer enters their products and suppliers on the platform, an email is sent to suppliers asking them to fill in the necessary data. This crucial step is often a source of frustration and blocka
DEFINITION OF THE TARGET AUDIENCE AND USERS
(EMPATHY MAP)

The empathy map is a key tool for understanding users' needs, frustrations, thoughts, and behaviors. In this project, it allows us to synthesize feedback from suppliers involved in data collection for Trace For Good. By visualizing their words, thoughts, actions, and emotions, we identify concrete areas for improvement to optimize their experience on the platform.
This exercise guides our UX approach in order to design a solution that is truly tailored to their expectations and constraints.
(PERSONA)

Li Wei Zhang represents a key user type within the traceability platform we are designing. This persona was selected because it embodies a recurring user profile among suppliers in the textile sector, mainly located in Asia. These users are directly involved in managing traceability data for major brands, which is crucial for meeting regulatory requirements and ensuring complete transparency.
• His role (quality manager) is directly related to the use of the platform: he collects, organizes, and submits the information necessary for product traceability.
• His work environment (China, textile factory) reflects the linguistic and technical challenges faced by many international suppliers, making it a representative case for designing an inclusive solution.
• His workload and responsibilities highlight the need for an intuitive and fast interface, adapted to the time constraints and high expectations of brands.
(USER STORY)
As a quality manager in a textile factory, I want an intuitive and easy-to-understand platform so that I can quickly and accurately fill in the information requested by international brands.
This User Story highlights the essential need for a quality manager in a textile factory: to have a clear and intuitive tool to effectively manage traceability data. It reflects time constraints and the importance of avoiding errors, while emphasizing the need for an interface adapted to users who may face linguistic or technical barriers. This approach guides the design towards a simplified and accessible platform that meets the expectations of end users and client brands.
(JOURNEY MAP)

This Journey Map illustrates the key stages in the journey of a user, in this case a quality manager, when using the traceability platform. Each stage identifies specific tasks, emotions experienced, and opportunities for improvement to make the experience more seamless.
• Why this map is important: It highlights moments of frustration (e.g., language barriers, process complexity) and points of satisfaction (such as confirmation of successful submission). These insights guide design priorities.
• Key opportunities:
1. Simplify access from the outset with a clear email and detailed instructions.
2. Offer intuitive navigation and smart search to quickly find the necessary documents.
3. Integrate real-time validations and contextual help messages to minimize errors.
4. Add transparent validation tracking to build trust and satisfaction.
By structuring the user journey in this way, we identify critical points for optimization and propose targeted solutions to improve the overall experience on the platform.
(PROBLEM STATEMENT)
Li Wei is a quality manager at a textile factory who needs a simple and intuitive tool to quickly and accurately fill in the traceability data requested by international brands, as she is often faced with a complex interface, unclear instructions, and a lack of precise feedback on the data submitted.
This Problem Statement highlights the needs and challenges faced by a quality manager like Li Wei. It emphasizes the need for a user-friendly and effective tool to manage traceability data, while identifying points of friction: complex interfaces, unclear instructions, and a lack of precise feedback. This framework guides the design of a tailored solution focused on simplicity, accessibility, and reliability to improve user experience and productivity.
WIREFRAMES
(WIREFRAMES VERSION 1)
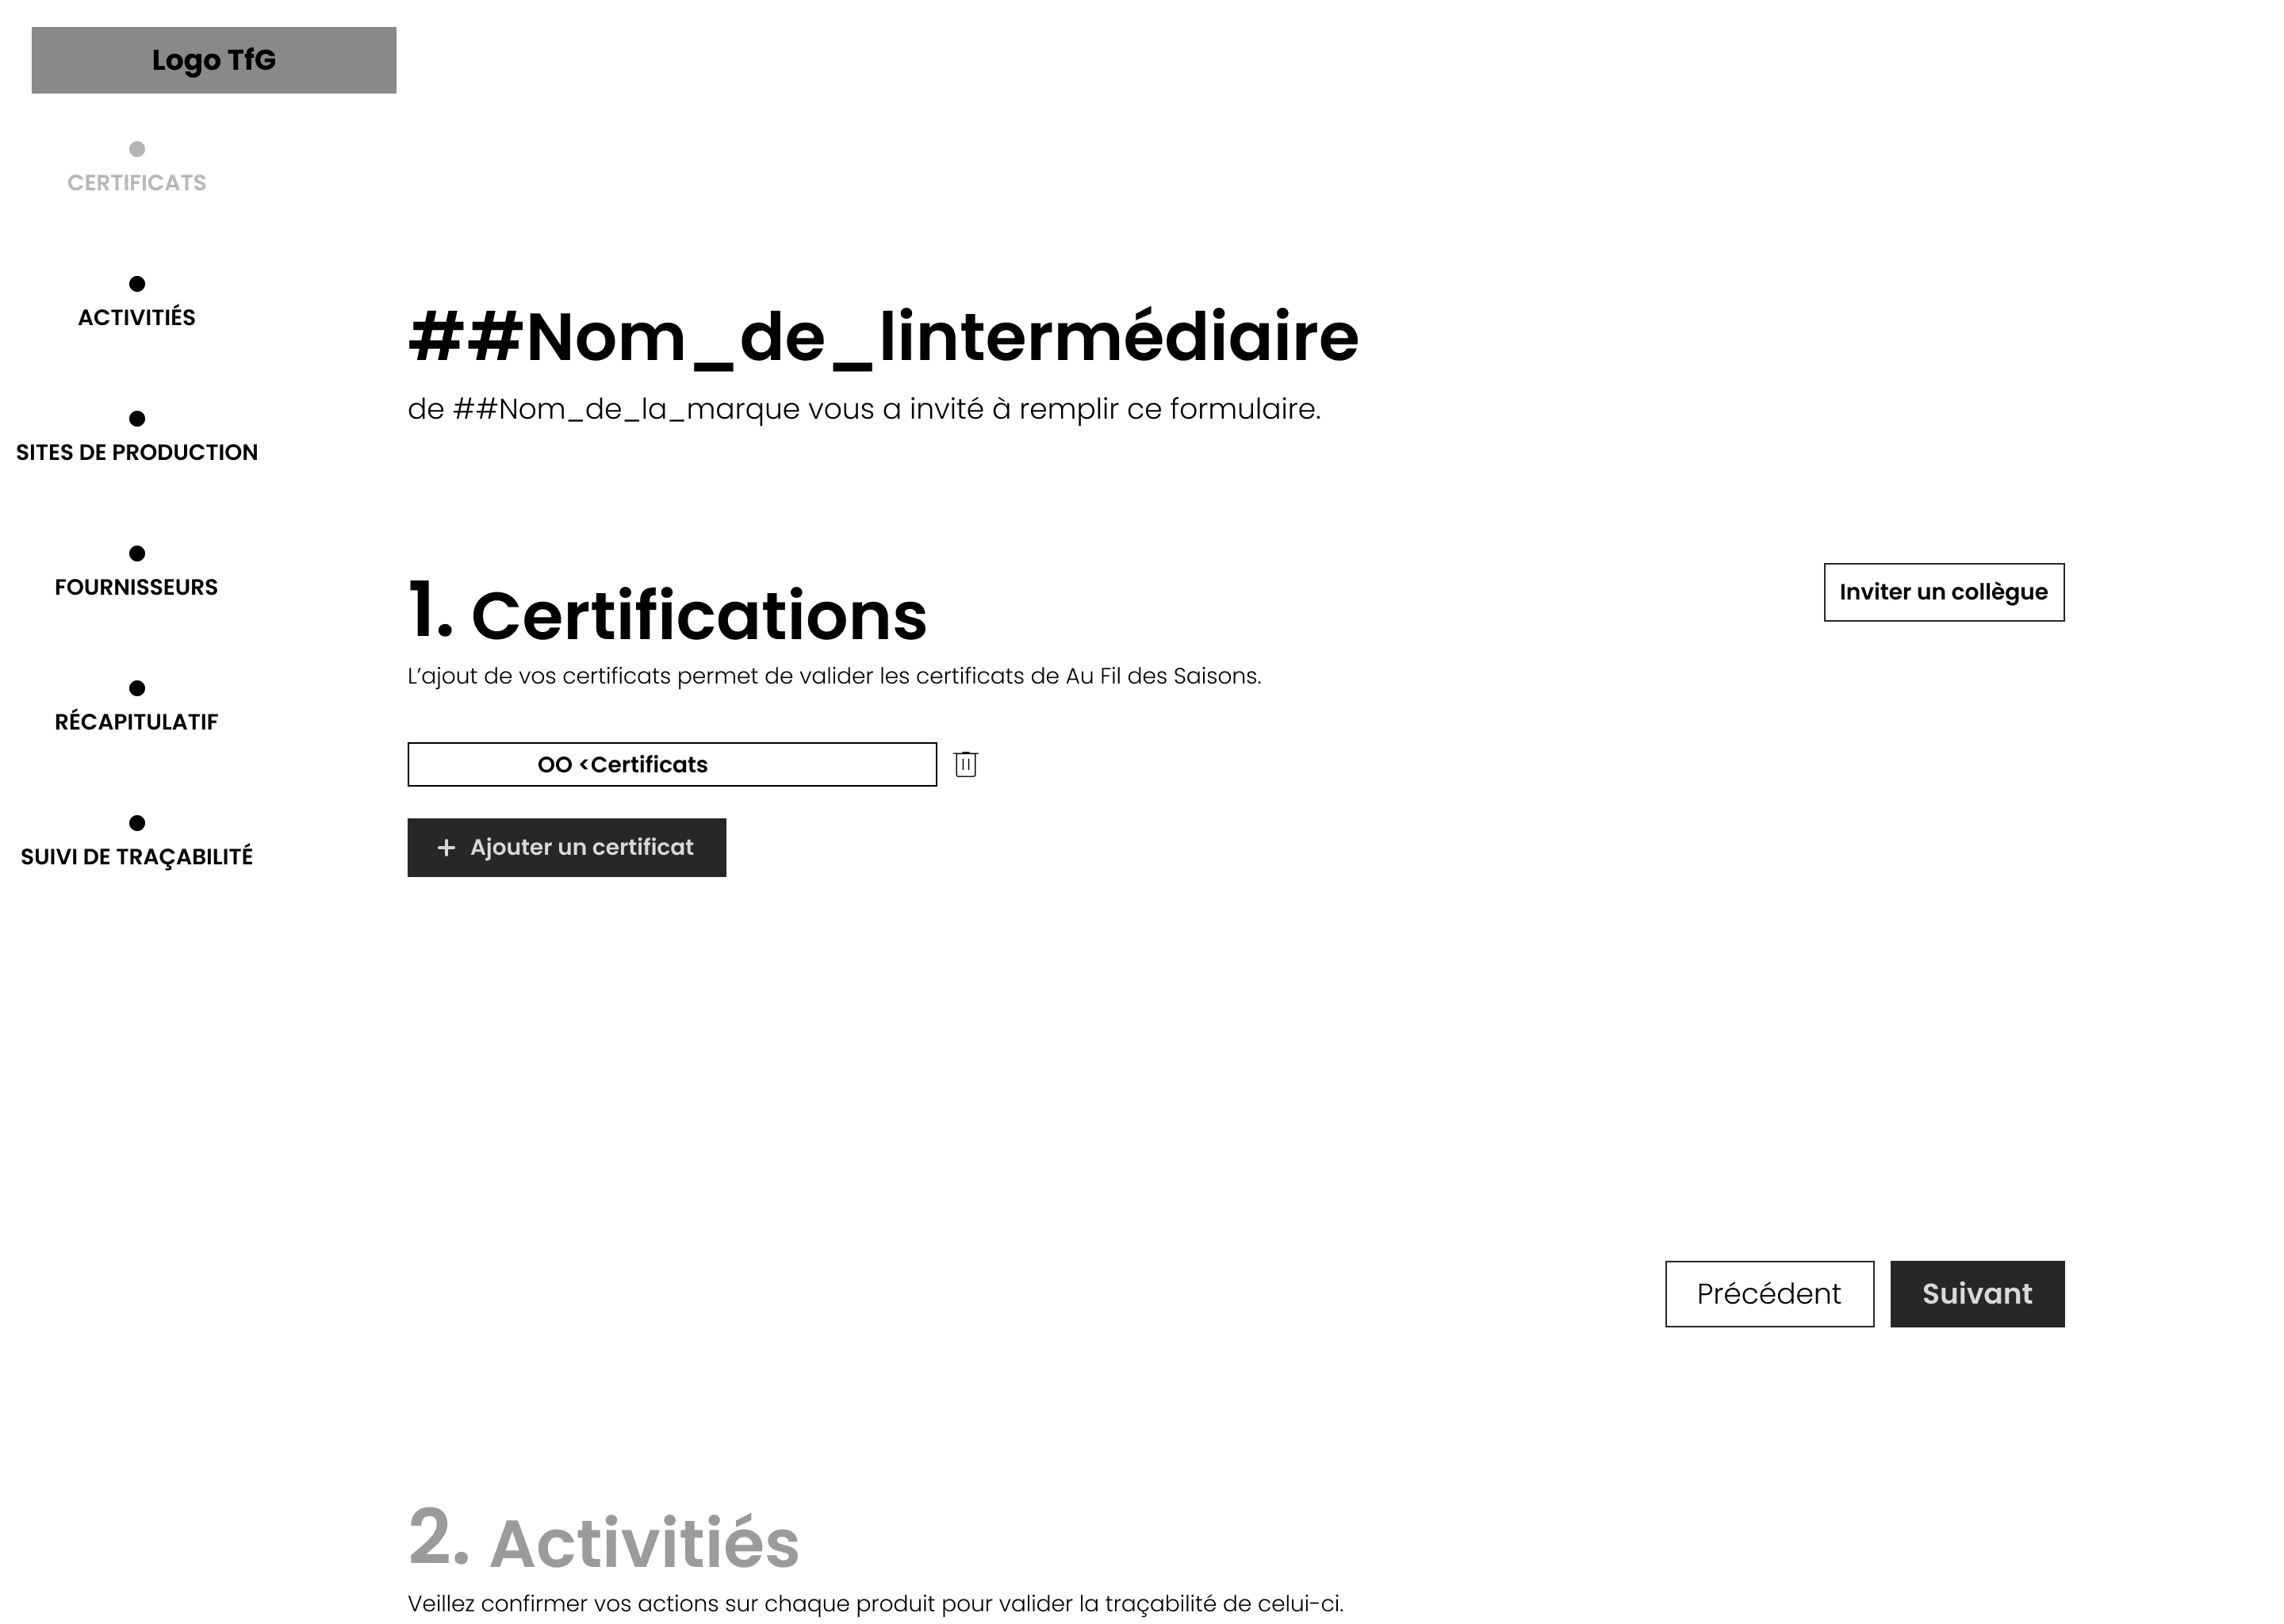
This first version of the wireframes presents an interface designed as an interactive questionnaire, guiding the user through the key stages of the traceability process. The aim was to structure the information in a clear and intuitive way while maintaining a logical flow.
We designed this interface in this form to test its feasibility and the initial user experience. In the future, we plan to develop this functionality further in order to integrate new interactions and adapt the user journey to the specific needs of businesses.
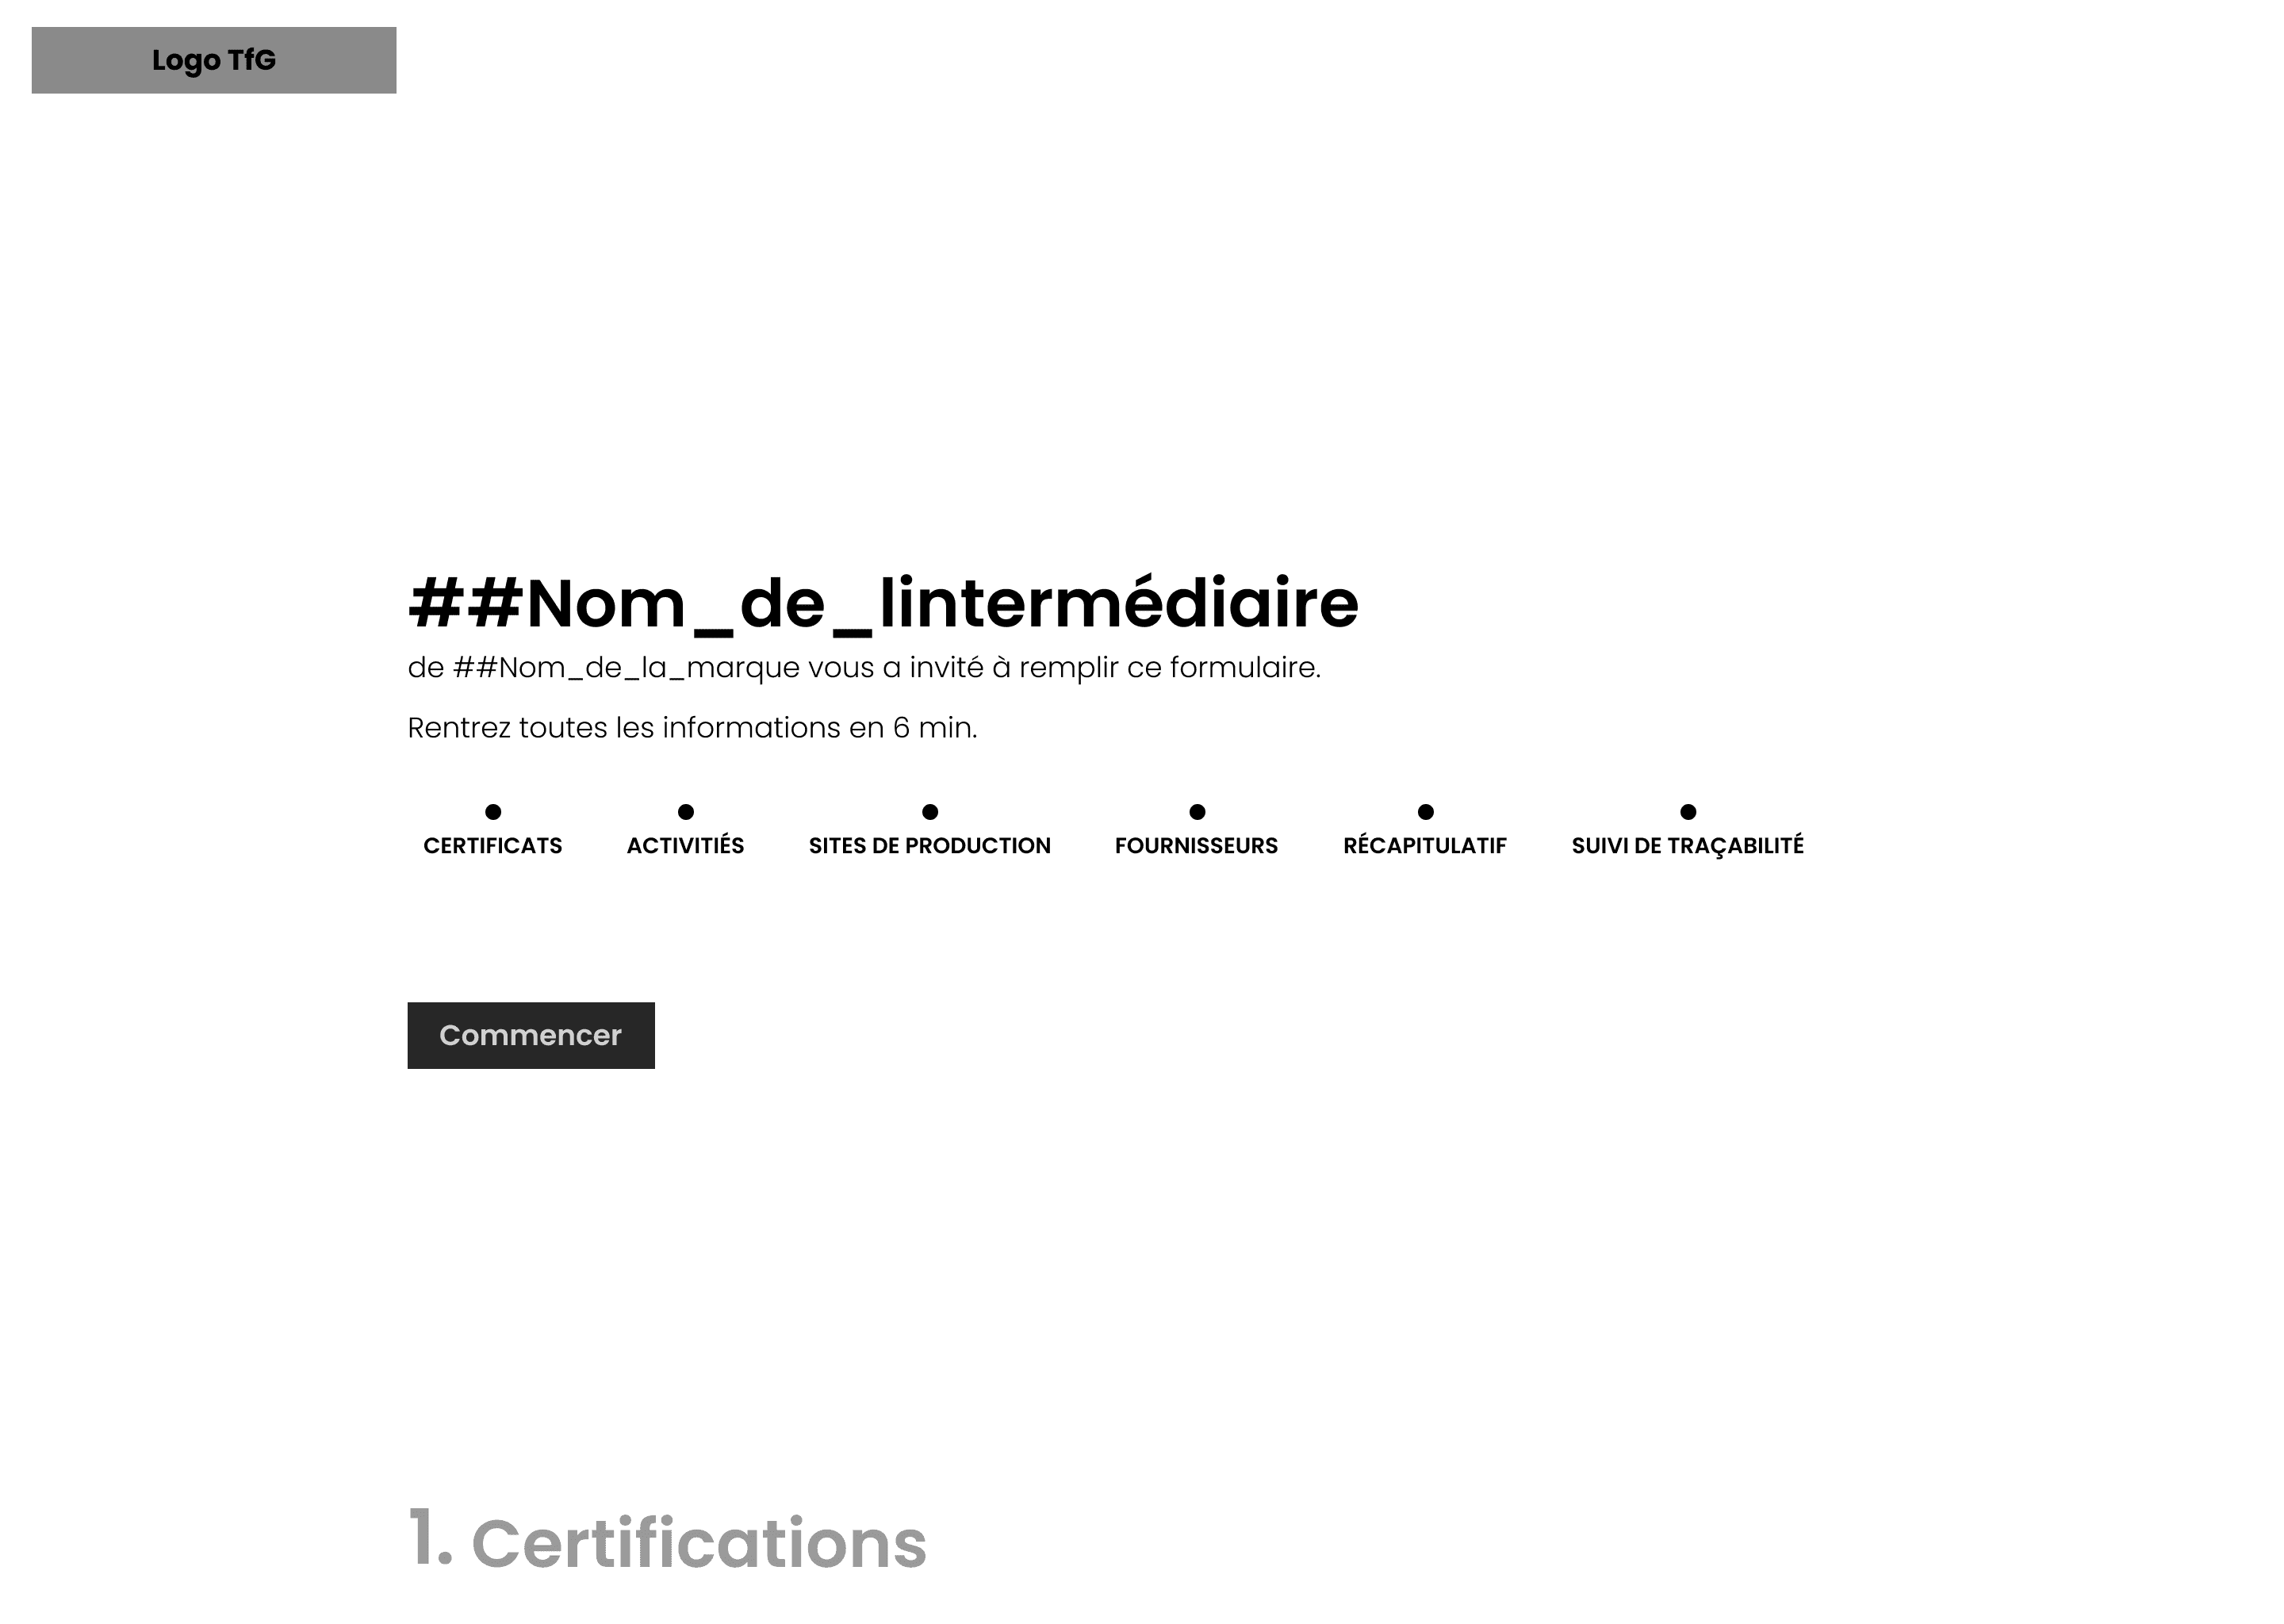
Welcome and introduction
The first frame is what the user sees when they click on the link received by email. It serves as an introduction to the form, briefly explaining its purpose and indicating the estimated time needed to complete it (6 minutes). The emphasis is on clarity and accessibility to encourage the user to get started quickly.
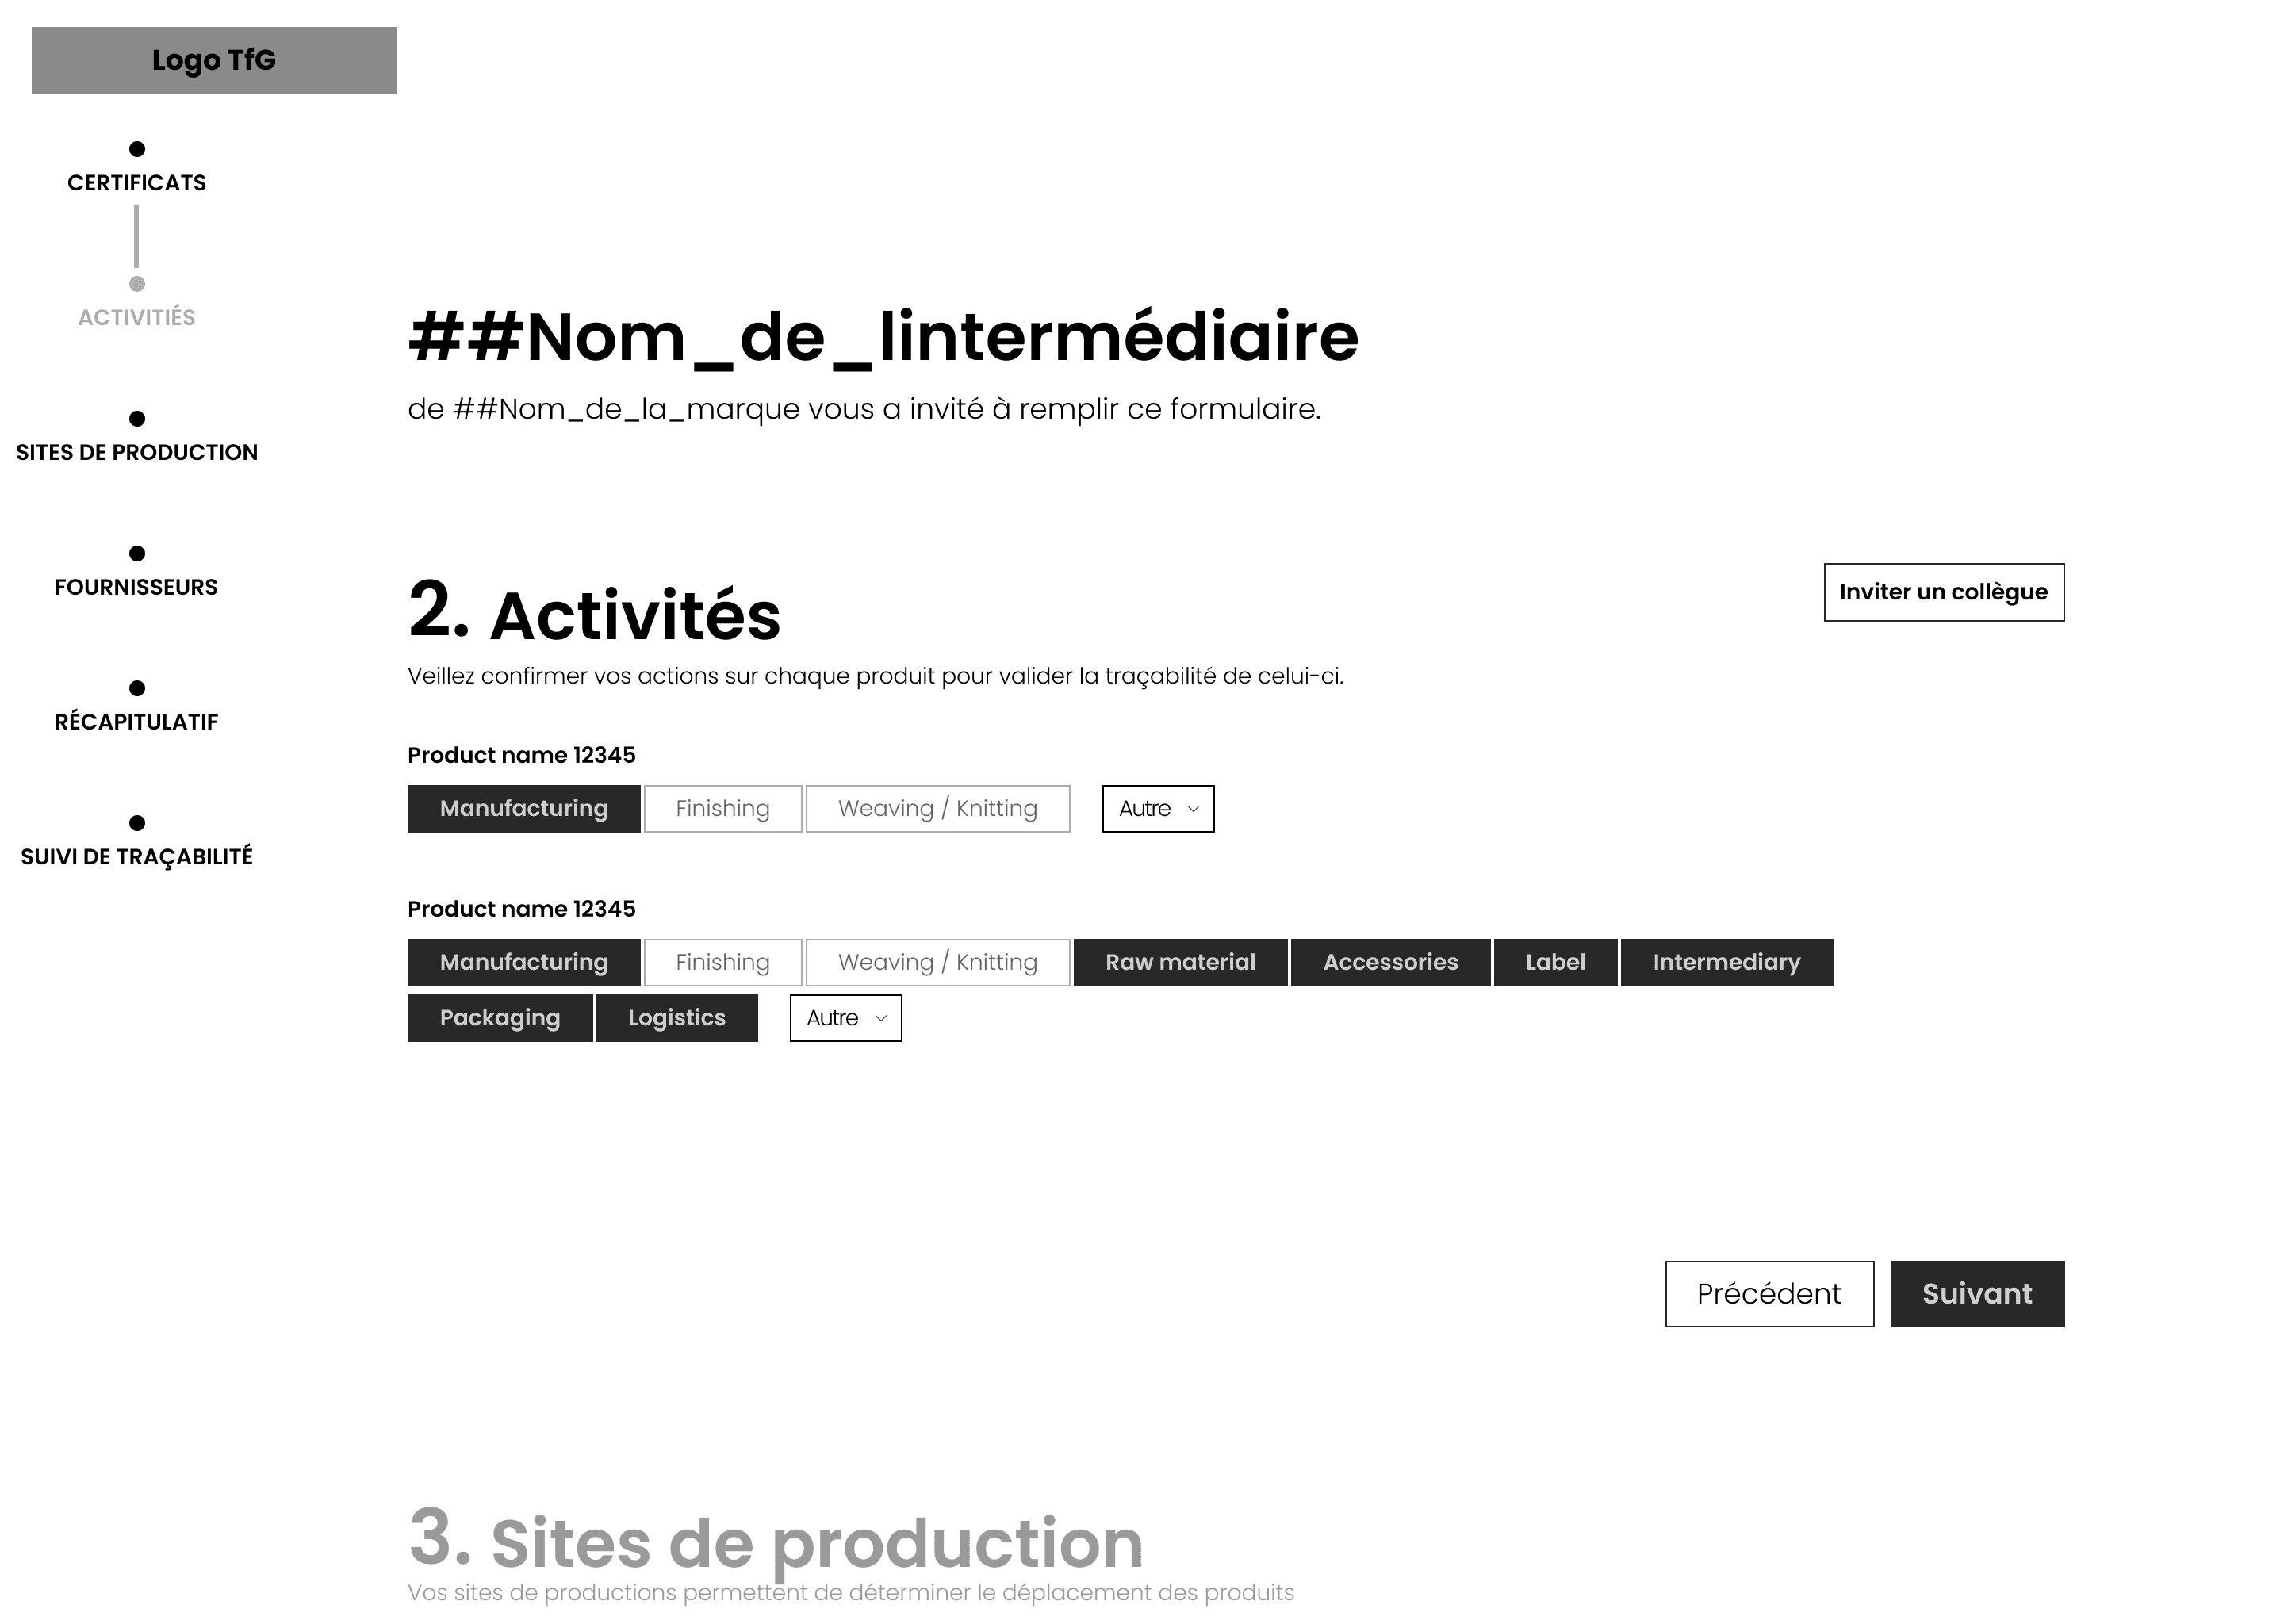
Activity information
The second frame asks the user to specify the activities carried out by their company for each product. Each activity category is represented by clear, interactive buttons (manufacturing, finishing, logistics, etc.), making selection easier and reducing the risk of error.
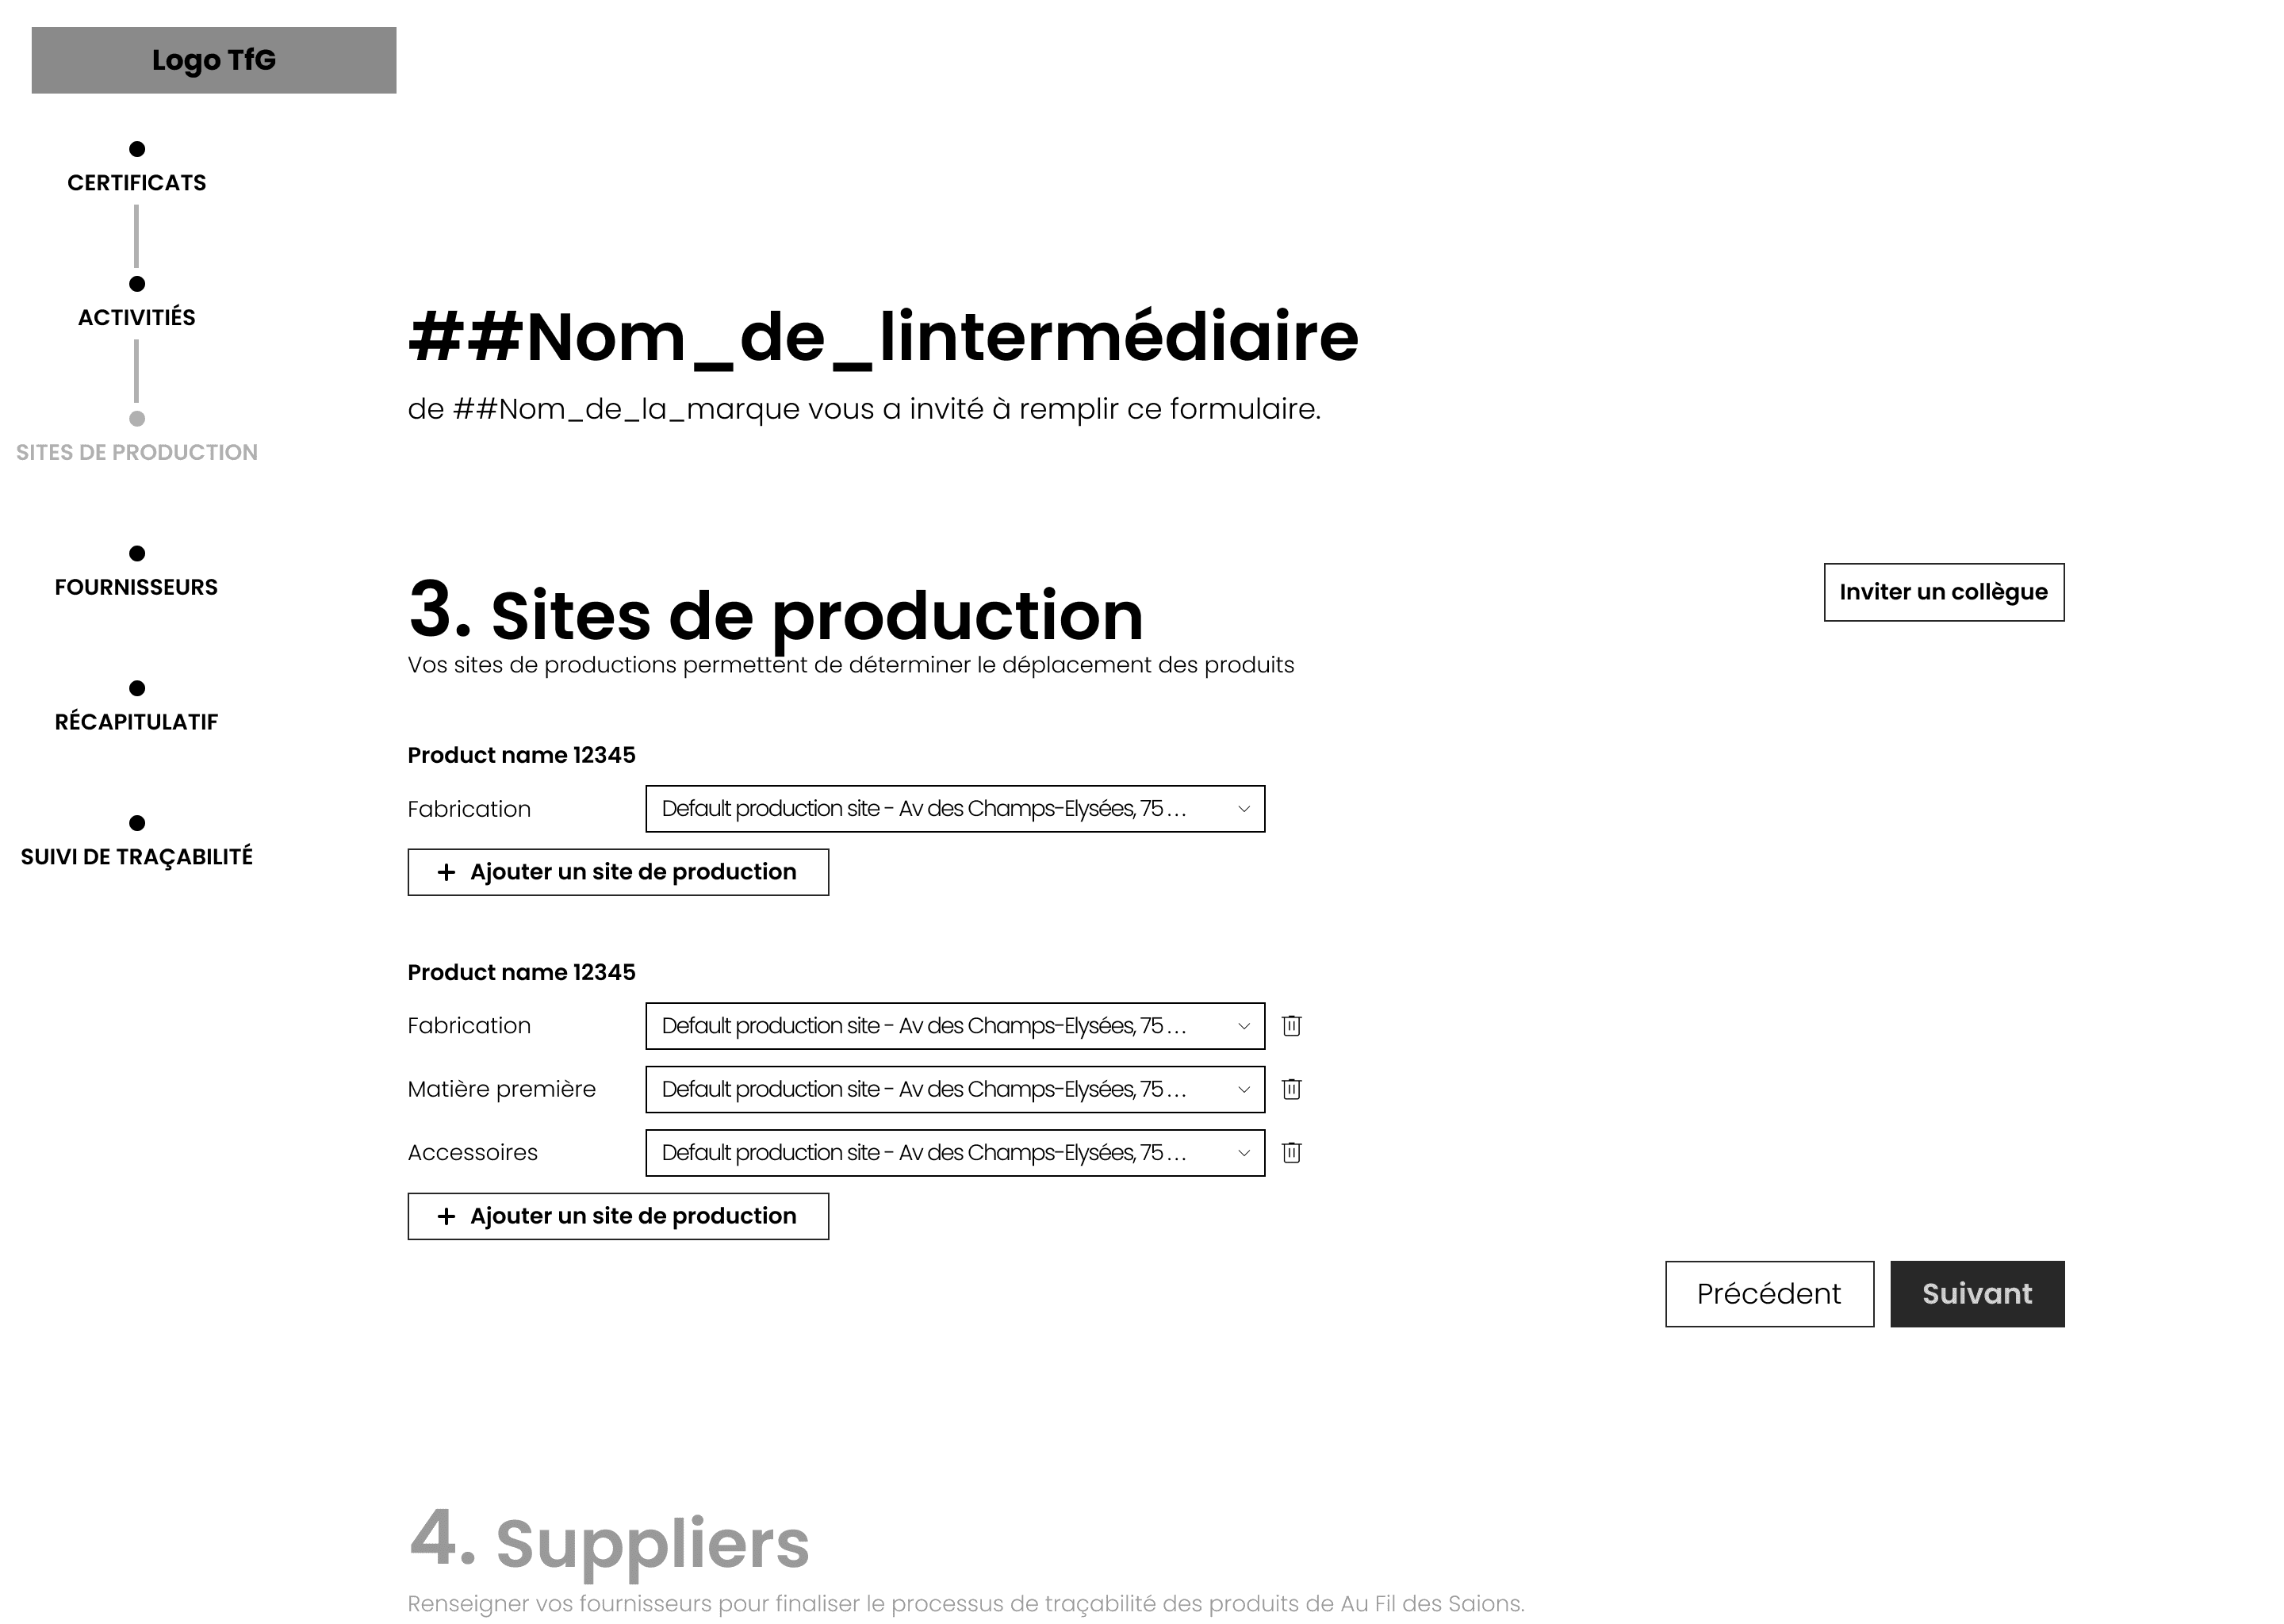
Production sites
At this stage, the user enters the locations where the various stages of production take place. A dynamic selection system and the ability to add sites allow for quick and flexible data entry, while adapting to the realities of complex production lines.
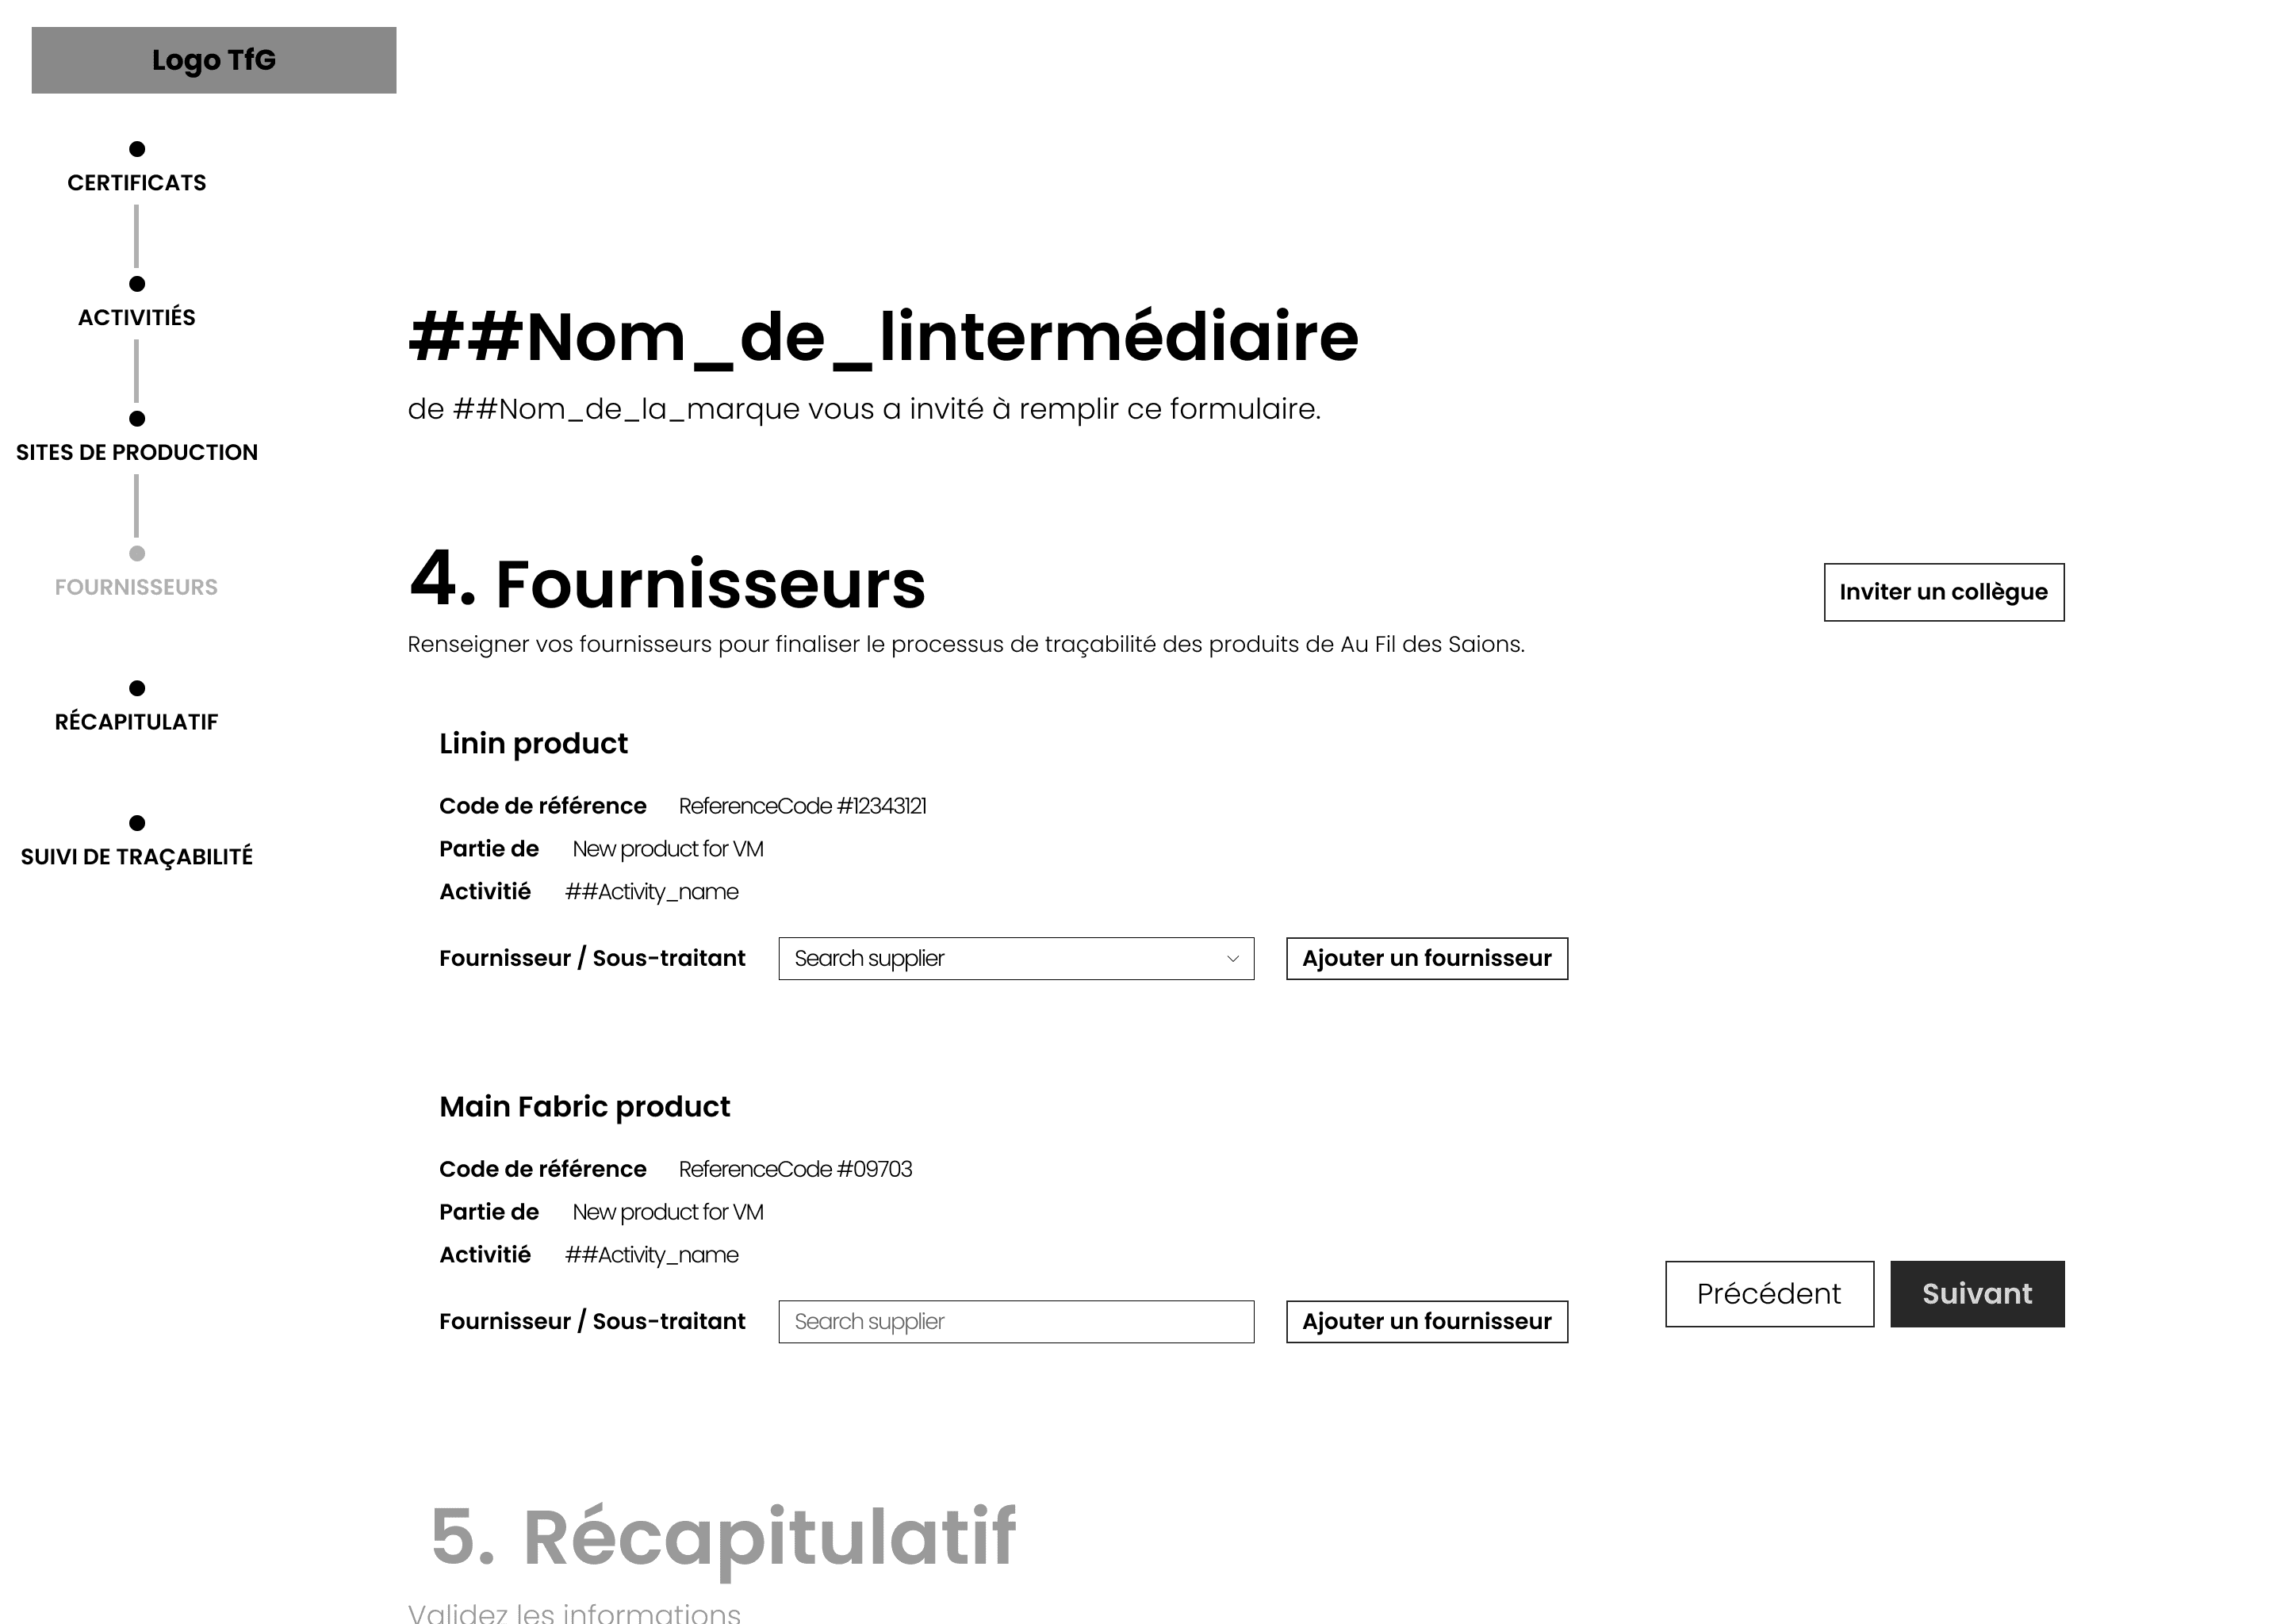
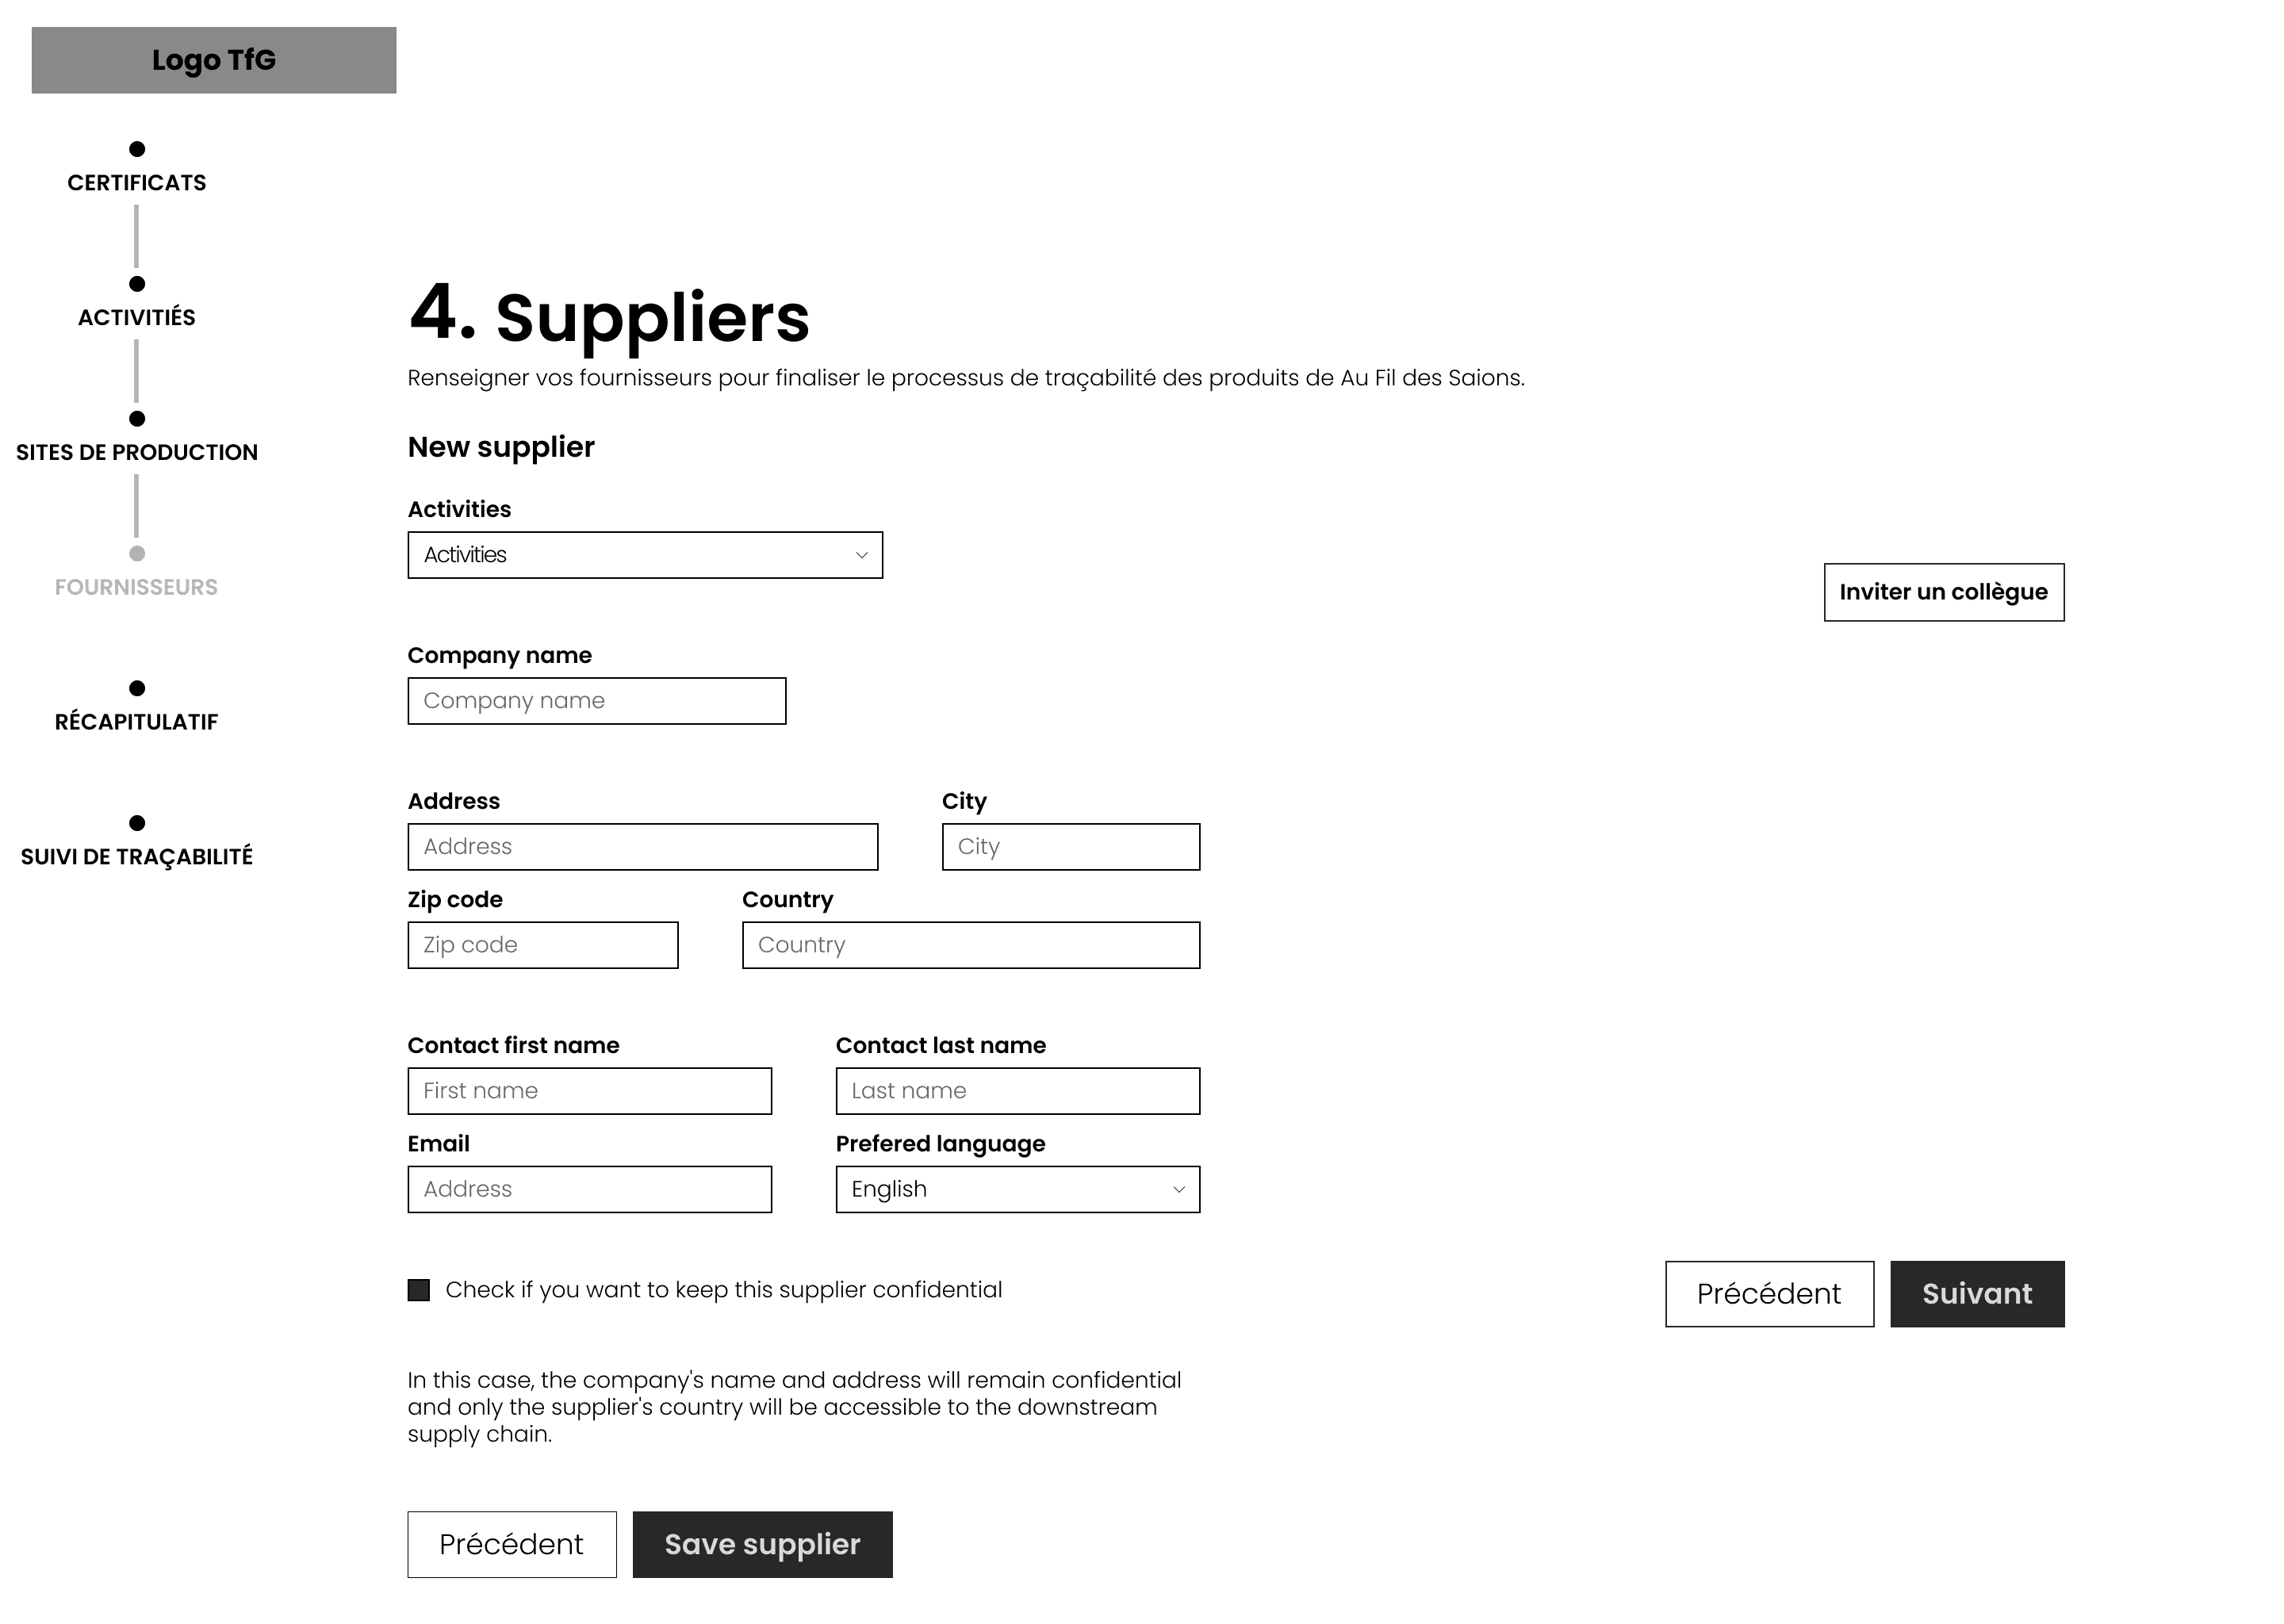
Suppliers
This frame prompts the user to identify and enter only suppliers related to this specific product. The fields are designed to easily search for and select an existing supplier or add a new one if necessary. This step ensures complete traceability of raw materials and components.
Summary
A summary page summarizes all the information entered in the form (certifications, activities, production sites, suppliers). This overview allows the user to verify the accuracy of the data and easily return to a specific section to make changes.
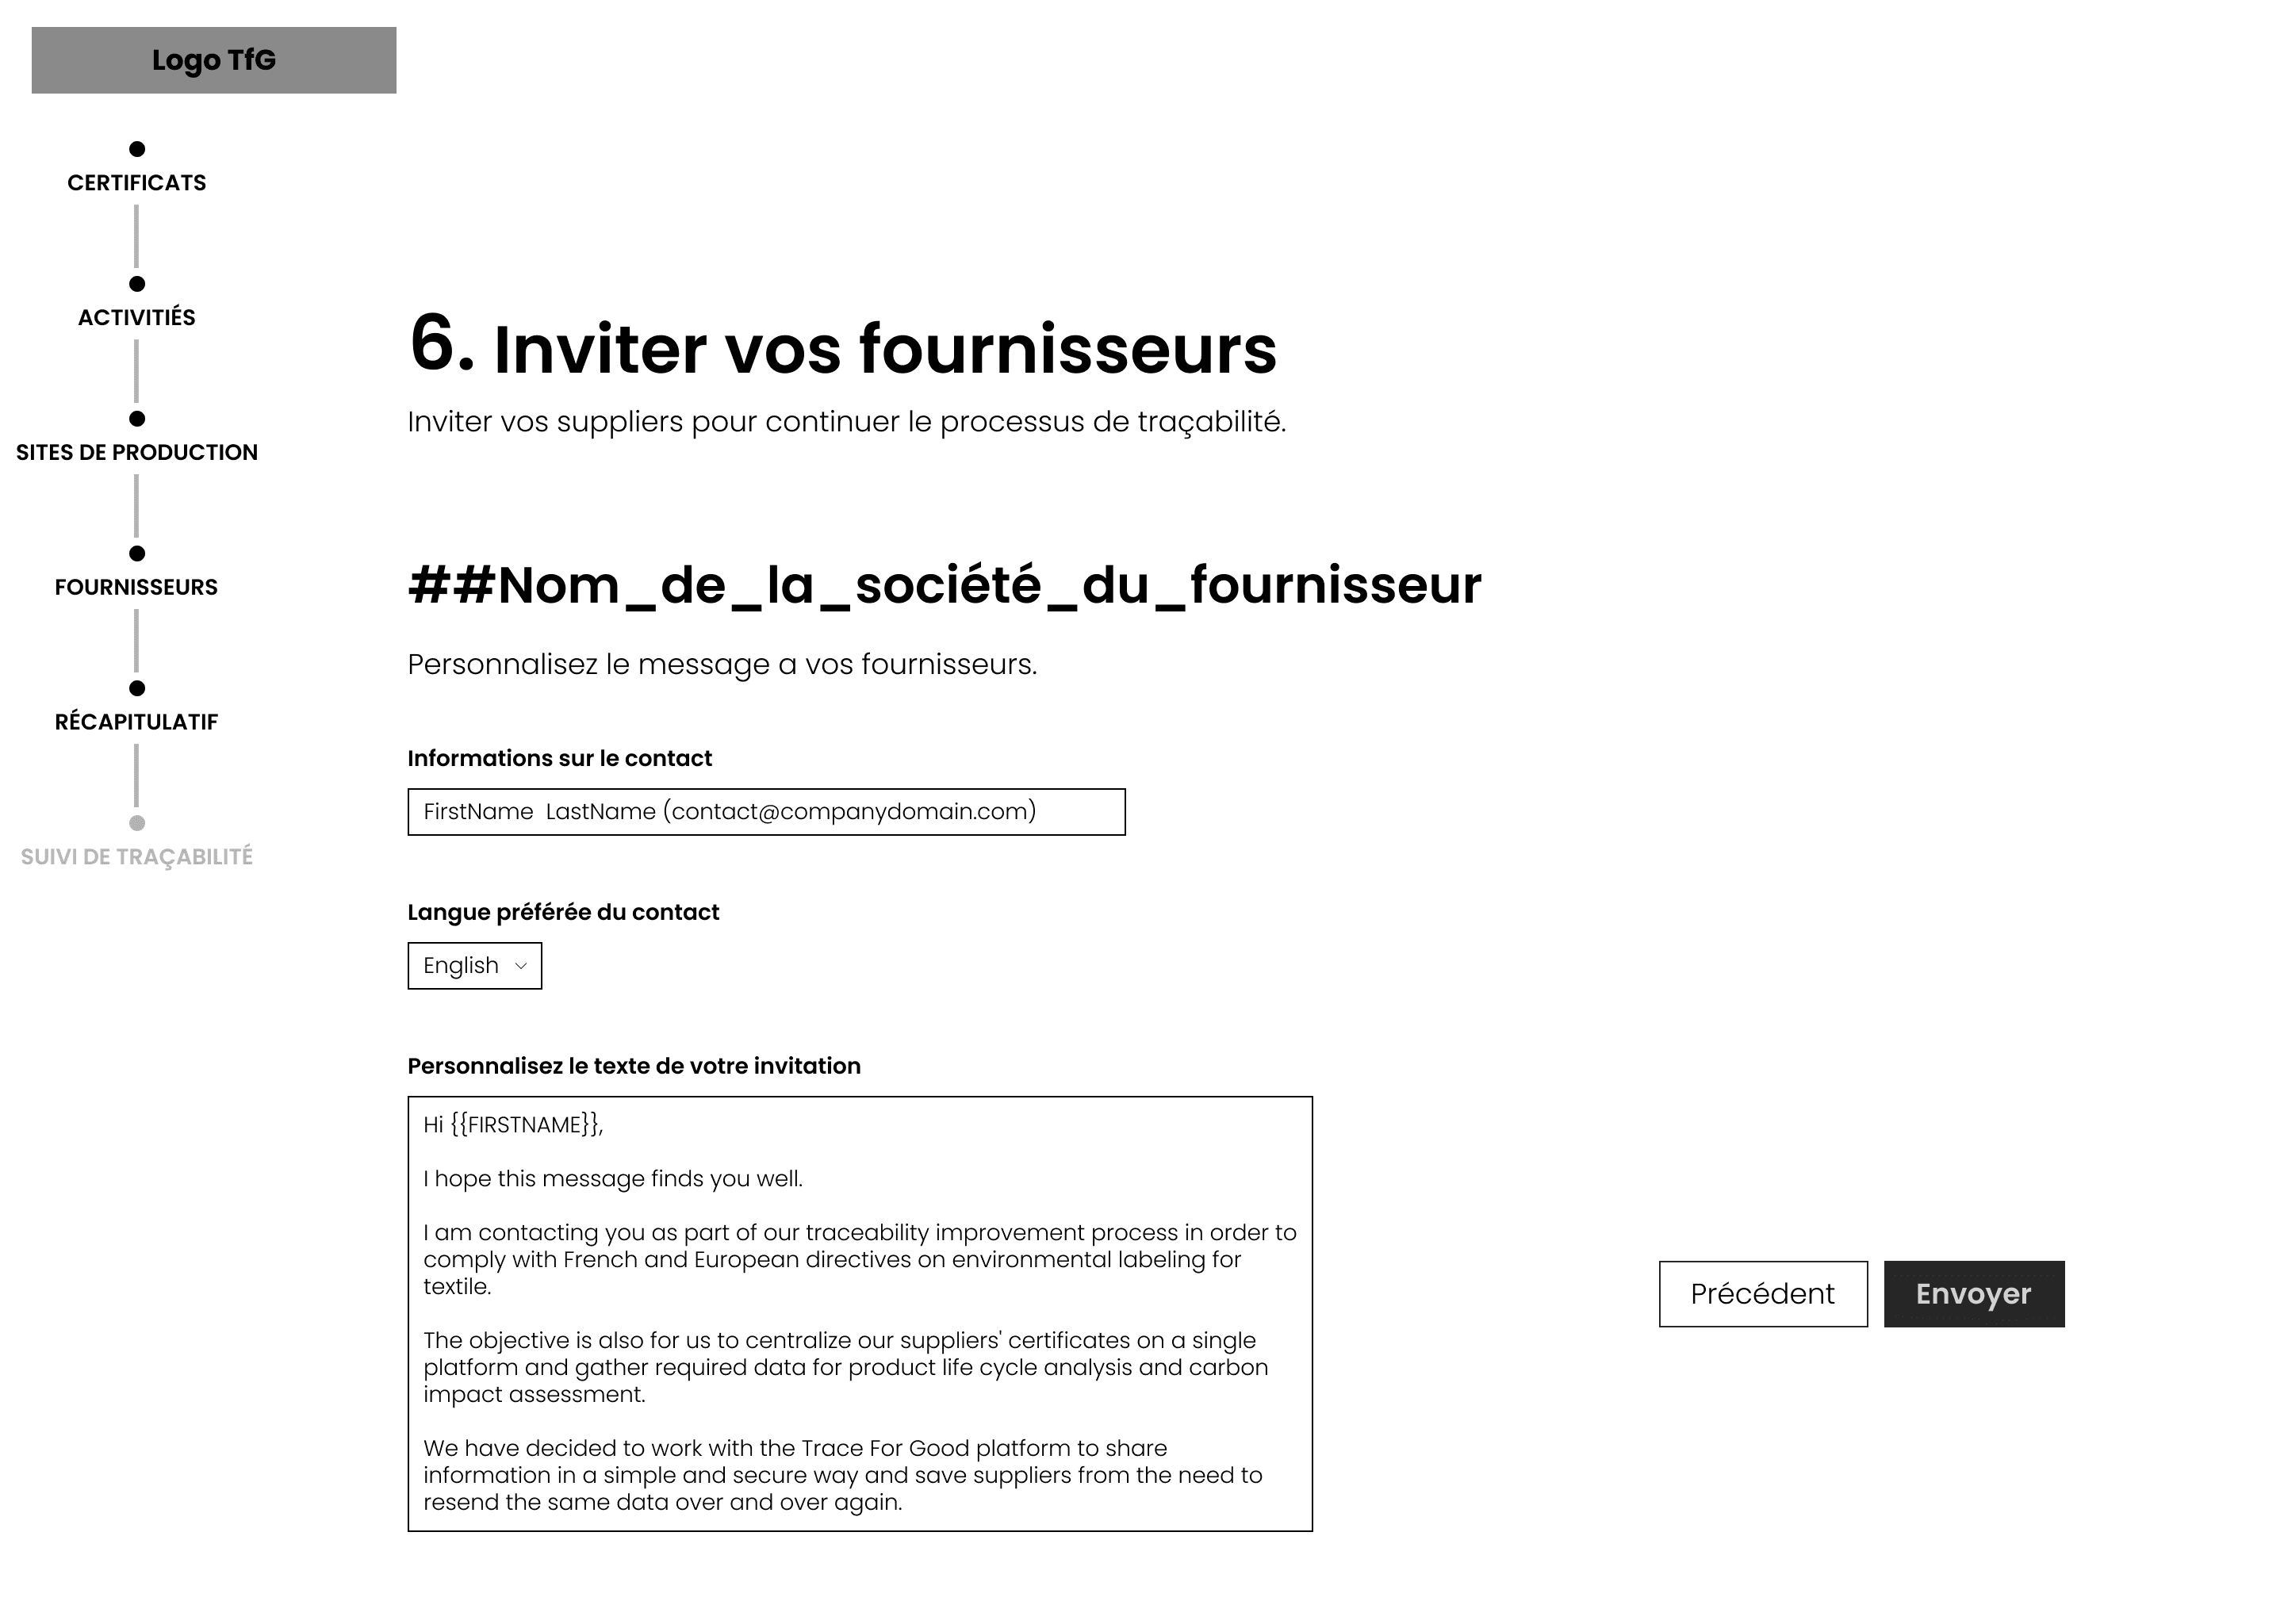
Customization of the invitation to suppliers
Finally, the user can customize the message sent to their suppliers inviting them to join the platform and share their data. This step emphasizes collaboration and aims to facilitate the traceability process while respecting the confidentiality of exchanges.
(FINAL MODEL)
The initial mockups focused on the structure of the user journey, with an emphasis on simplifying the main tasks.
These wireframes helped identify initial areas of friction, such as complex navigation or unclear instructions.
The final interactive mockups represent the culmination of an iterative design process based on a deep understanding of user needs. These prototypes reflect an interface optimized to offer a fluid, functional experience tailored to suppliers' expectations.
Unlike a simple form, the final mockup takes the form of a true platform. It offers modular and intuitive navigation, integrating several key features to simplify traceability data management, while providing a clear and structured overview of the tasks to be performed.
[1 Client request]
Here is the final interface dedicated to suppliers. The section presented in this video is divided into two complementary parts: Requests and Submitted.
In Requests, all requests received are centralized.
In Submitted, you will find the history of completed and submitted requests.
We have chosen to categorize requests by type rather than by the supplier who made the request. This decision was based on user feedback and discussions during the various iterations. In fact, it is common for several people to be involved in completing a request, each contributing their specific expertise. By separating requests by type, each employee can focus solely on those they are able to complete, thereby improving the efficiency and clarity of the process.
[2 Traceability request]
Here are the details of the section dedicated to filling out a traceability request for a brand. We have noticed that, in many cases, users share the same suppliers for all of a customer's products. To simplify the process, we offer a feature that allows users to enter a production site common to all products of a brand directly from the request. This approach optimizes the process and significantly reduces the time required to enter information.
[3 Suppliers requests]
We are now in the Suppliers Requests section of the supplier platform. To trace the production chain, suppliers are asked to provide information about their own suppliers and send them the necessary requests for information.
In this section, users can track the progress of requests sent and the completion of data by their suppliers. In addition, they can contact suppliers directly. To make this easier, we provide a pre-written message that they can quickly copy and send. This feature aims to simplify communication and speed up the information gathering process.
[4 Production sites]
In the Production Site section, users can manage their production sites centrally. They can enter the address, contact details of the manager, and certifications associated with each site. This organization allows them to quickly and easily select the relevant production sites when responding to a customer request.
[5 Request traceability Version2]
Here is an alternative version of the Traceability Requests section display, presented here in graphical form. This representation provides a clearer view of the links between the various suppliers, offering a better understanding of the relationships within the production chain.
We have also noticed that some suppliers are involved in several stages of the manufacturing process for a product. This view therefore makes it easier for them to track the progress and completion of data related to their specific contributions.
In this example, the user, as the last intermediary, has information about the production site, final manufacturing, and product weaving. However, they indicate that they are not responsible for or do not have information about the dyeing of the material. Once their part is complete, they can forward the request to the supplier responsible for dyeing, who can then fill in the missing data.